Sichuan University, ETH Zurich and USTC team maps localized hydrogen activation around one plasmonic junction


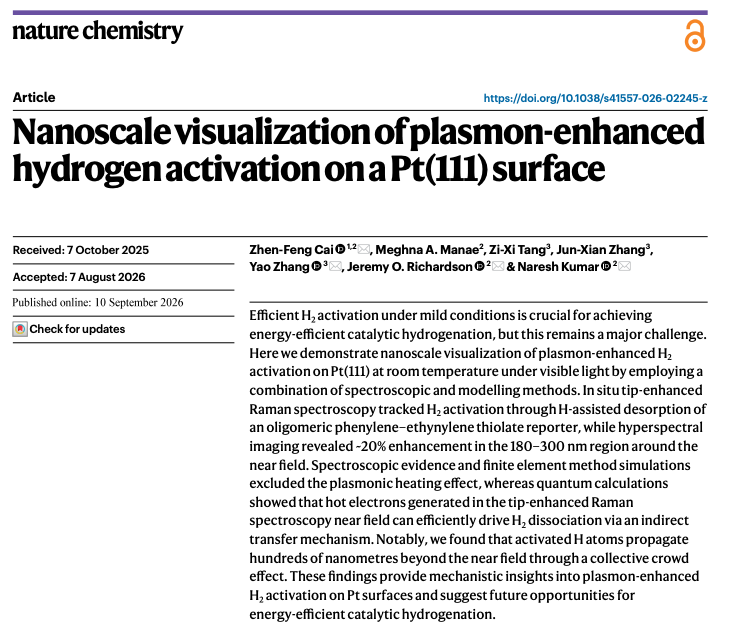
Source: https://www.nature.com/articles/s41557-026-02245-z
At a glance
Researchers from Sichuan University, ETH Zurich and the University of Science and Technology of China have examined the chemical response around a single light-driven junction on platinum. They positioned a silver tip above an OPE-thiolate-covered Pt(111) surface, illuminated the nanocavity at 632.8 nm and used tip-enhanced Raman spectroscopy (TERS) to follow the response during room-temperature H₂ exposure. Surface hydrogen assists the desorption of the OPE reporter, so a fading Raman signal provides a spatial window onto hydrogen activation.
At 3.6 μW μm⁻² and after 15 seconds of H₂ exposure, the reporter intensity fell by 84% within an approximately 180 nm tip-centred footprint, compared with 64% outside it. A separate 25-second experiment produced an approximately 300 nm footprint, with losses of 77% inside and 56% outside. With the laser off, H₂ caused a spatially uniform 52% loss and the localized footprint disappeared. Together with the controls and calculations, these maps support the authors’ interpretation of hot-electron-assisted H₂ activation followed by the outward movement of surface hydrogen through a coverage-dependent crowd effect.
The researchers did not directly observe H₂ molecules dissociating or individual H atoms moving. The measured signal was the loss of the OPE reporter, which serves as a proxy for the presence of surface hydrogen.
Background
H₂ activation is the opening step in many hydrogenation reactions. Conventional measurements often average over many particles or reaction sites, which can conceal the chemistry around an individual nanoscale hot spot. Plasmonic systems present an additional mechanistic challenge because light can concentrate an electromagnetic field, generate non-equilibrium carriers and warm the surroundings at the same time. Separating these contributions is essential to understanding why a localized reaction changes under illumination.
The team constructed a spatially addressable system around Pt(111), a surface that can dissociate H₂ at room temperature even without illumination. A silver scanning tunnelling microscopy tip created the optical nanocavity. An oligomeric phenylene–ethynylene (OPE) thiolate monolayer acted as the chemical reporter. TERS detects its vibrational bands, while hydrogen-assisted desorption lowers their intensity. The resulting images therefore map reporter loss as a proxy for surface hydrogen rather than directly imaging H₂ dissociation or individual H atoms.
Research question
The study addresses three linked questions. Does visible-light excitation of a single Ag-tip–Pt(111) nanocavity produce a localized enhancement beyond the surface’s existing H₂ activation? Is that additional response better explained by heating or by energetic carriers? And can surface hydrogen carry the chemical response beyond the few-nanometre optical near field?
Inside the study
The first time-resolved experiment collected 100 consecutive one-second spectra at a single position. H₂ flow began at 27 seconds and continued for 15 seconds. Three OPE bands, at 2,210, 1,132 and 1,600 cm⁻¹, decreased immediately after H₂ flow began and approached a plateau after approximately 20 seconds. The result links the arrival of H₂ with rapid reporter desorption under illumination, but it does not provide a molecular count of H₂-dissociation events.
Two-dimensional hyperspectral maps then supplied the spatial evidence. Under the standard excitation intensity, a map sampled in 25 nm steps after 15 seconds of H₂ exposure revealed an approximately 180 nm footprint. Reporter intensity decreased by 84% inside the footprint and by 64% outside it.
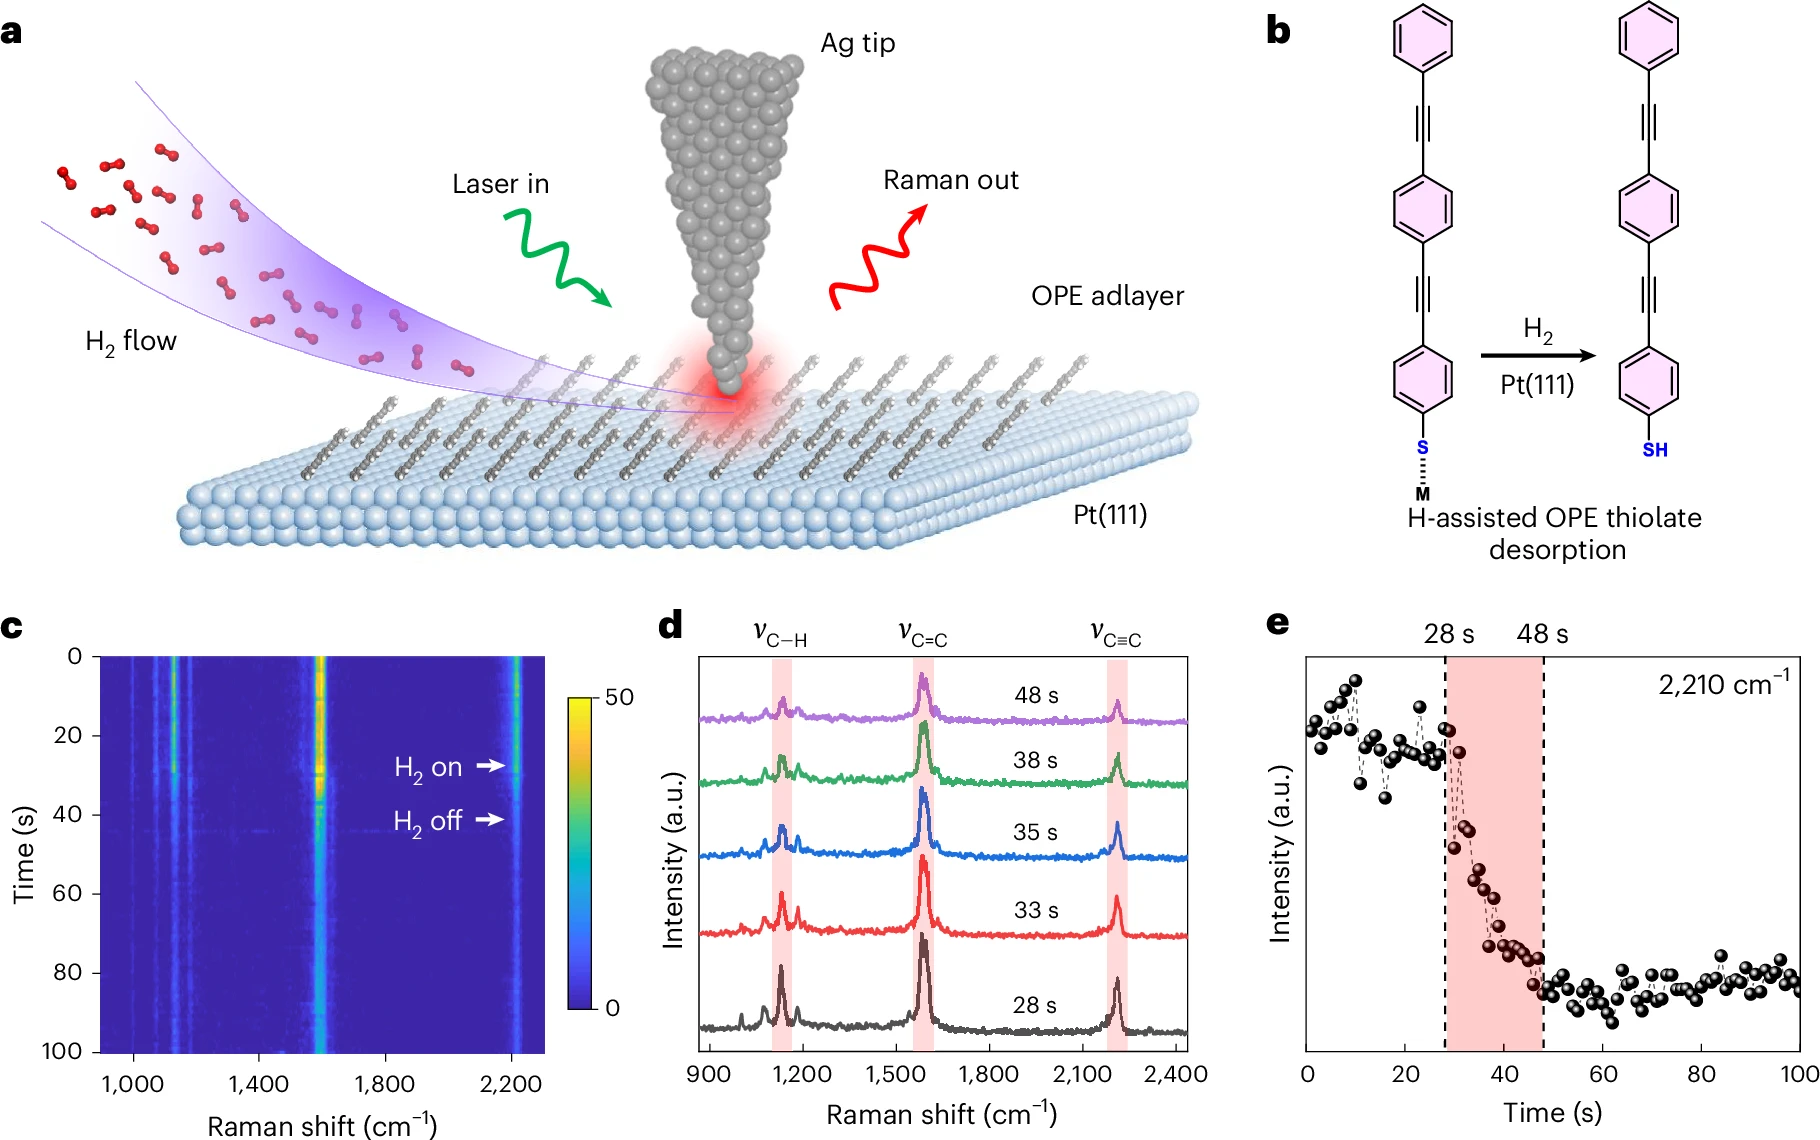
Fig. 1: In situ investigation of H2 activation on the Pt(111) surface.
The authors interpreted this 20-percentage-point difference as evidence for at least an approximately 20% localized enhancement in H₂ activation. That figure describes the additional reporter response. It is not a measurement of product yield, catalytic turnover frequency or industrial reaction efficiency.
An independent experiment used 33 nm steps and 25 seconds of H₂ exposure. It produced an approximately 300 nm footprint and a 21-percentage-point difference between its interior and exterior, with reporter losses of 77% and 56%, respectively.
The controls highlighted what illumination added to platinum’s background chemistry. With no laser, 15 seconds of H₂ exposure still reduced the OPE intensity by 52%, but the change was spatially uniform. On OPE-covered Au(111), H₂ caused no detectable reporter loss. Together, these results support the study’s central experimental observation: illuminating the Ag-tip–Pt(111) cavity produces a localized excess reporter response around the tip.
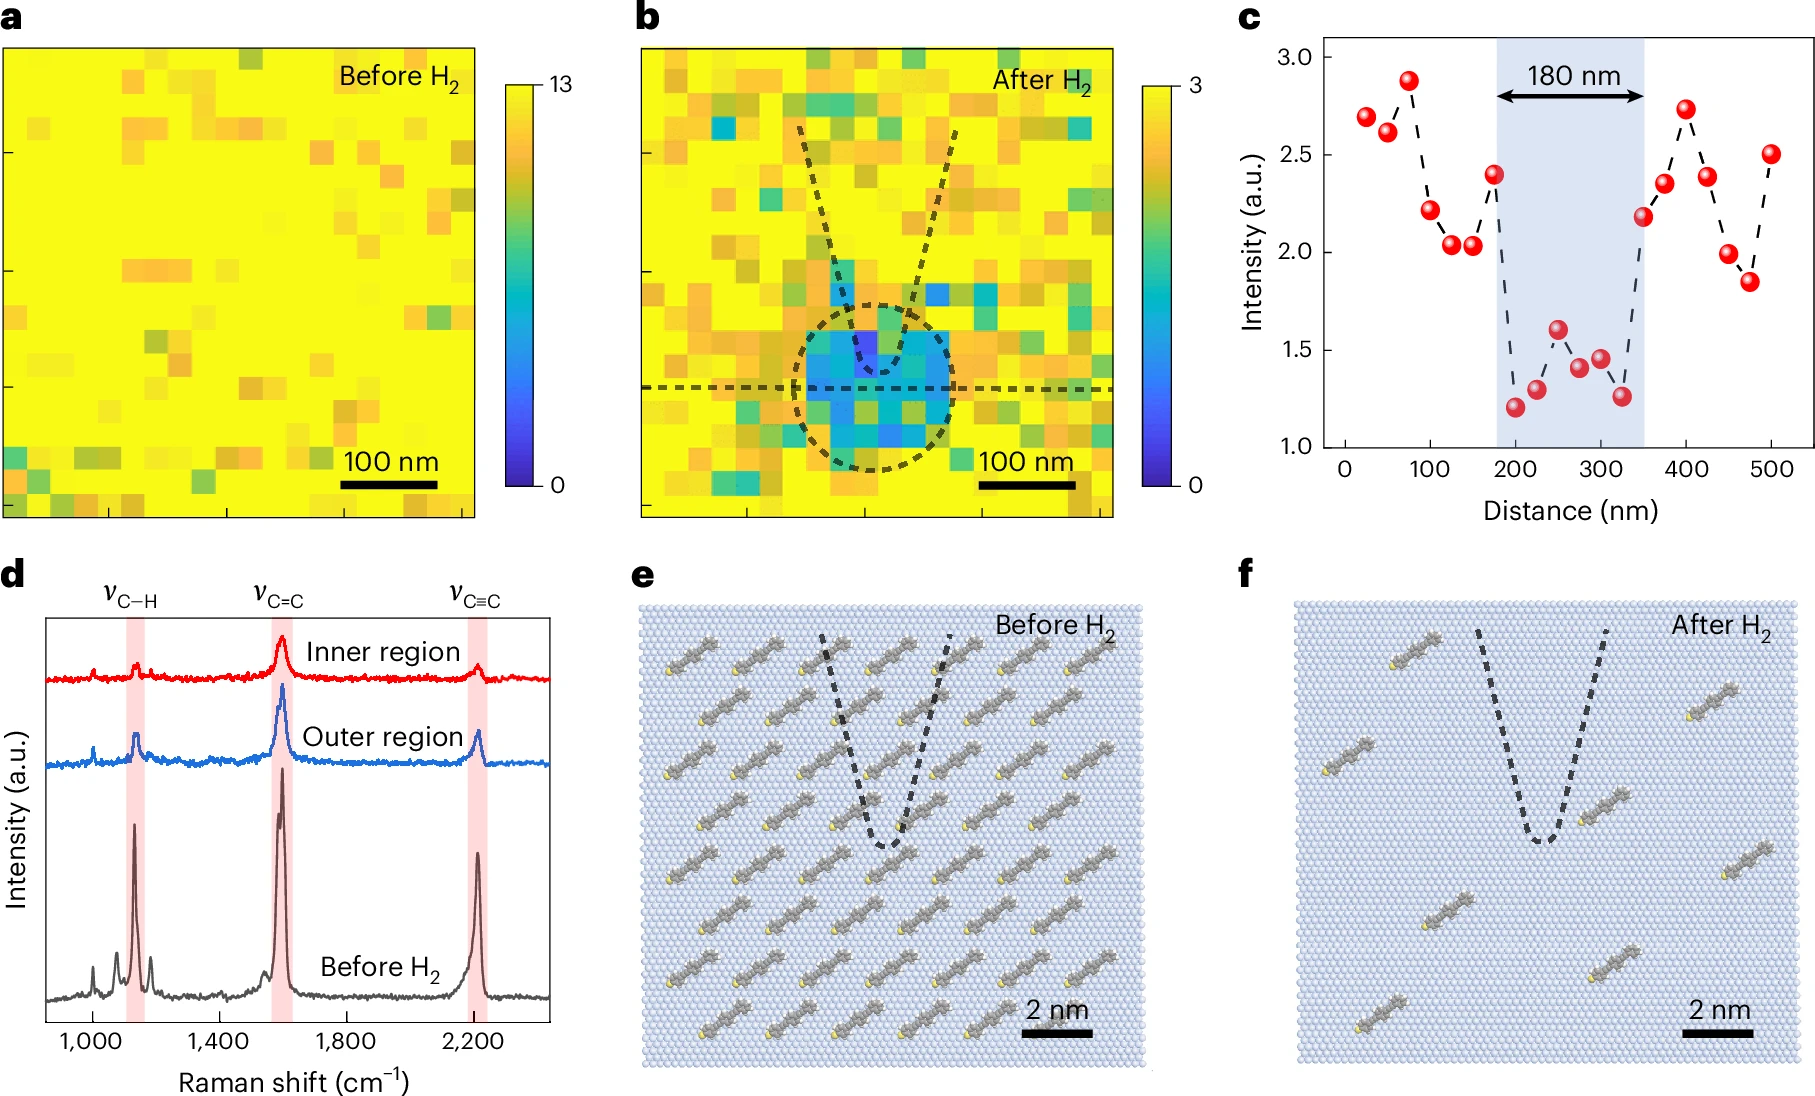
Fig. 2: Nanoscale visualization of H₂ activation on the Pt(111) surface.
Exposure time and excitation intensity also changed the mapped footprint. At 3.6 μW μm⁻², the enhanced-desorption areas after 5, 15 and 25 seconds were approximately 5.30 × 10³, 2.13 × 10⁴ and 4.78 × 10⁴ nm², respectively.
At 25.7 μW μm⁻² and after 5 seconds of H₂ exposure, the time-normalized area was approximately 5.58 × 10⁴ nm² s⁻¹. Under the standard excitation intensity, the corresponding values ranged from 1.06 × 10³ to 1.91 × 10³ nm² s⁻¹. These measurements demonstrate that the reporter-loss footprint changes with exposure time and illumination intensity. Because only a limited number of mapped conditions were reported, without replicate statistics or uncertainty estimates, the data do not establish a general scaling relationship.
Finite-element modelling helped the team compare heating with a carrier-based explanation. For an idealized 10 nm tip separated from platinum by a 1 nm gap under the standard illumination conditions, the model predicted a 533-fold electric-field enhancement and a near-field full width at half maximum of 5.9 nm.
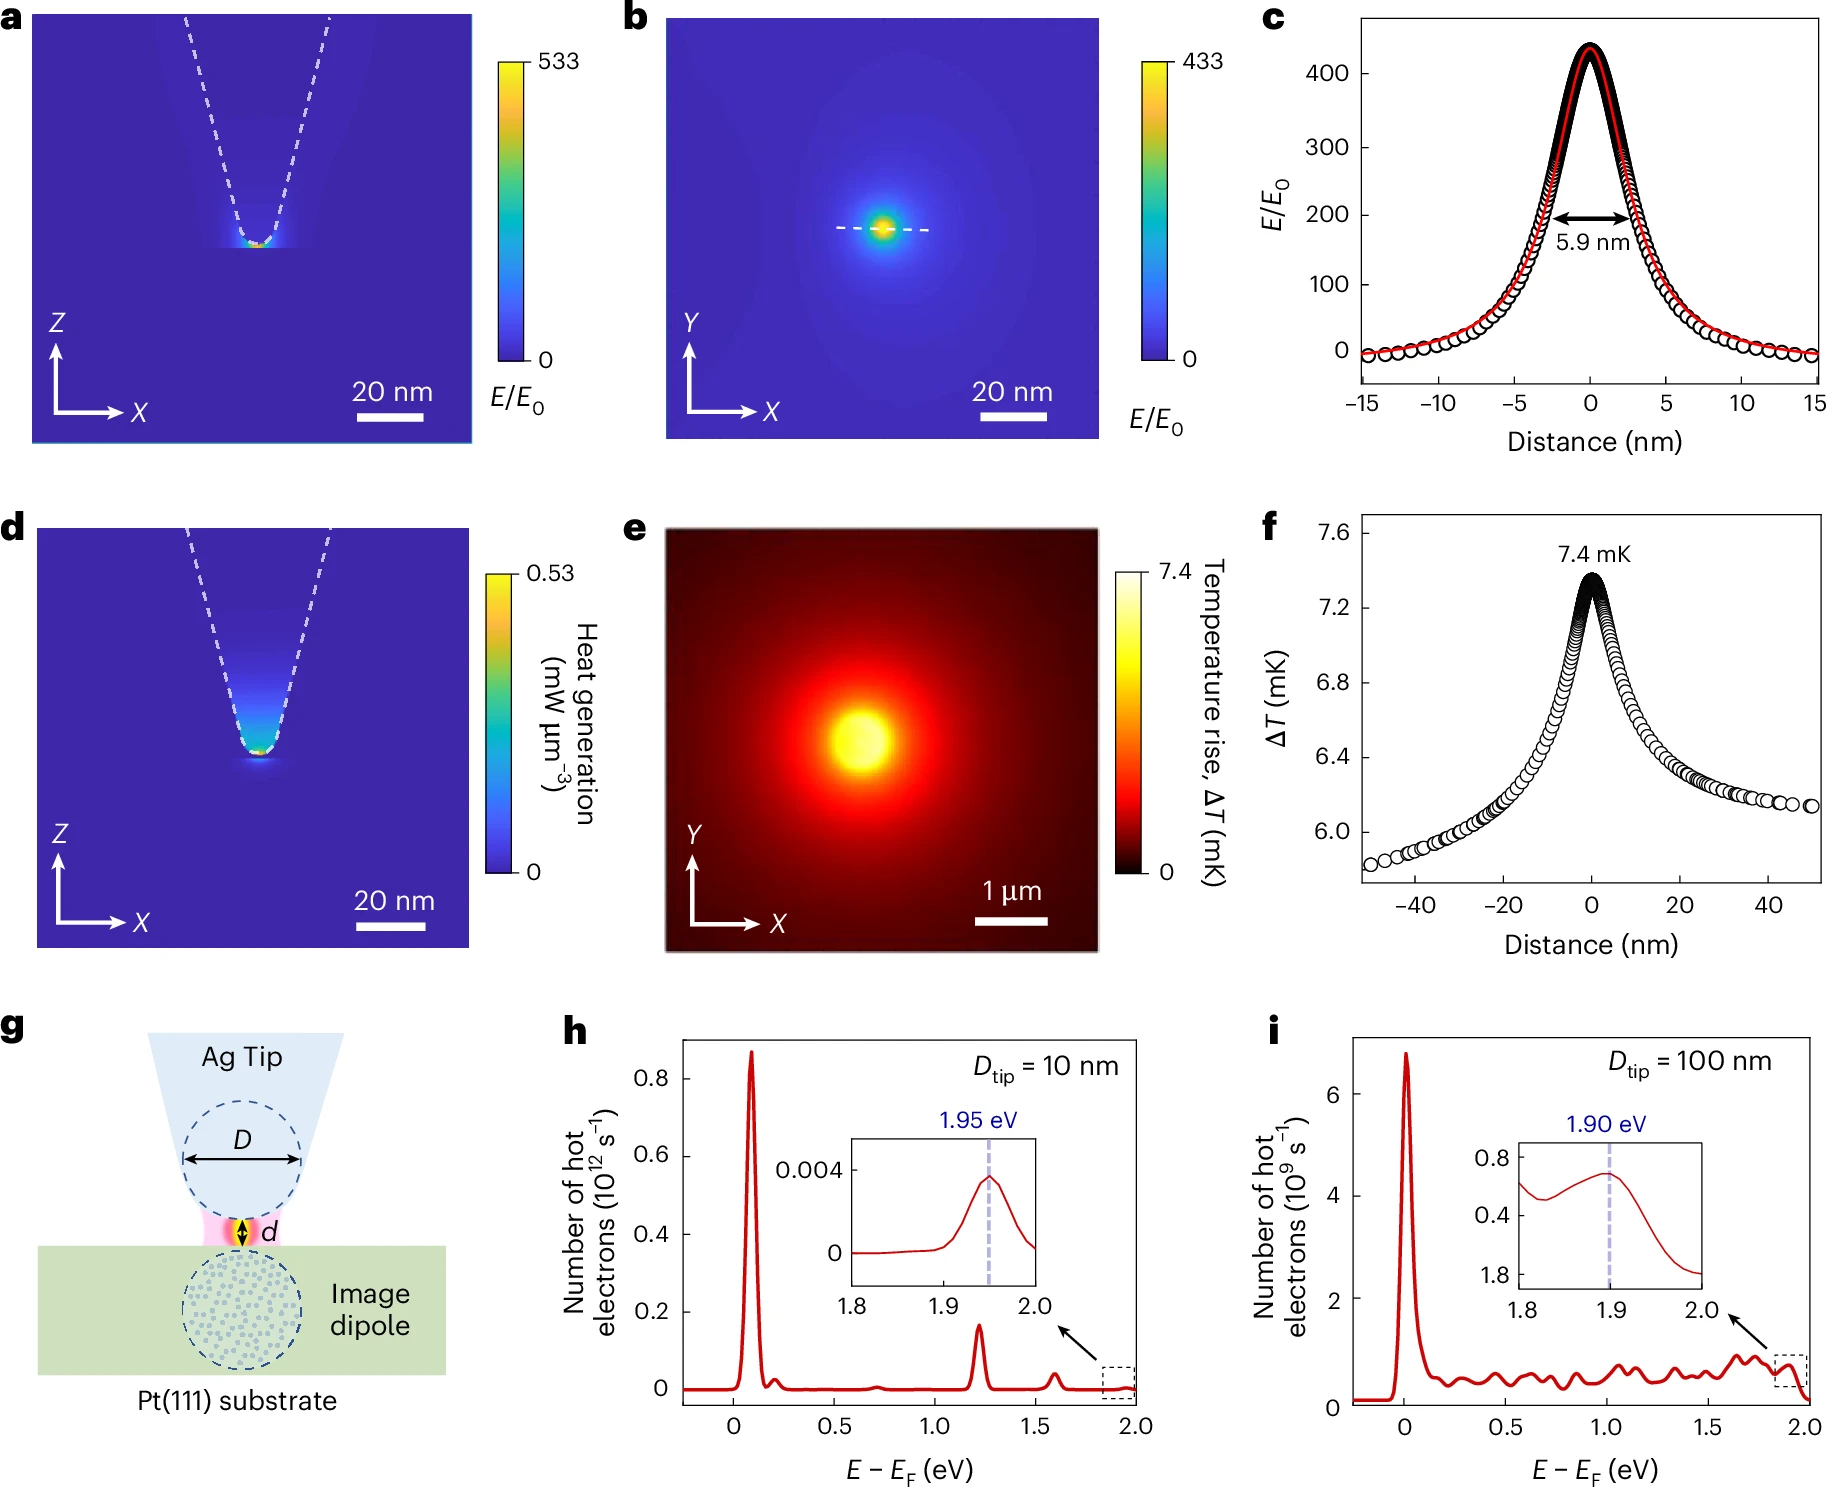
Fig. 3: Plasmonic heating in the tip-enhanced Raman spectroscopy near field on the Pt(111) surface.
The maximum calculated temperature rise on Pt was 7.4 mK. Across the modelled geometries, temperature rises remained between 6.6 and 9.5 mK. The paper estimated that an increase of approximately 24.7 K would be required to explain the roughly 20% enhancement in H₂ activation through heating alone. Within these modelled geometries and experimental conditions, local heating is therefore insufficient as the primary explanation. This conclusion should not be generalized to exclude photothermal effects in other plasmon-assisted catalytic systems.
A separate quantum-mechanical calculation represented the junction as an Ag–Pt nanoparticle dimer and assumed a hot-electron lifetime of 1 ps. The maximum calculated electron energies reached approximately 1.95 eV above the Fermi level for a 10 nm tip and 1.90 eV for a 100 nm tip.
The comparison barriers for H₂ dissociation varied with adsorption site and molecular orientation:
- 0.06 eV for a parallel configuration at a top site
- 0.46 eV for a parallel configuration at a bridge site
- 1.60 eV for a perpendicular configuration at an fcc site
- 2.91 eV for a perpendicular configuration at a bridge site
The calculated hot-electron energy distribution therefore makes several of the listed dissociation pathways energetically accessible, but not every pathway. This provides energetic support for the authors’ hot-electron interpretation. However, neither hot-electron transfer to H₂ nor formation of the proposed transient negative-ion state was directly observed.
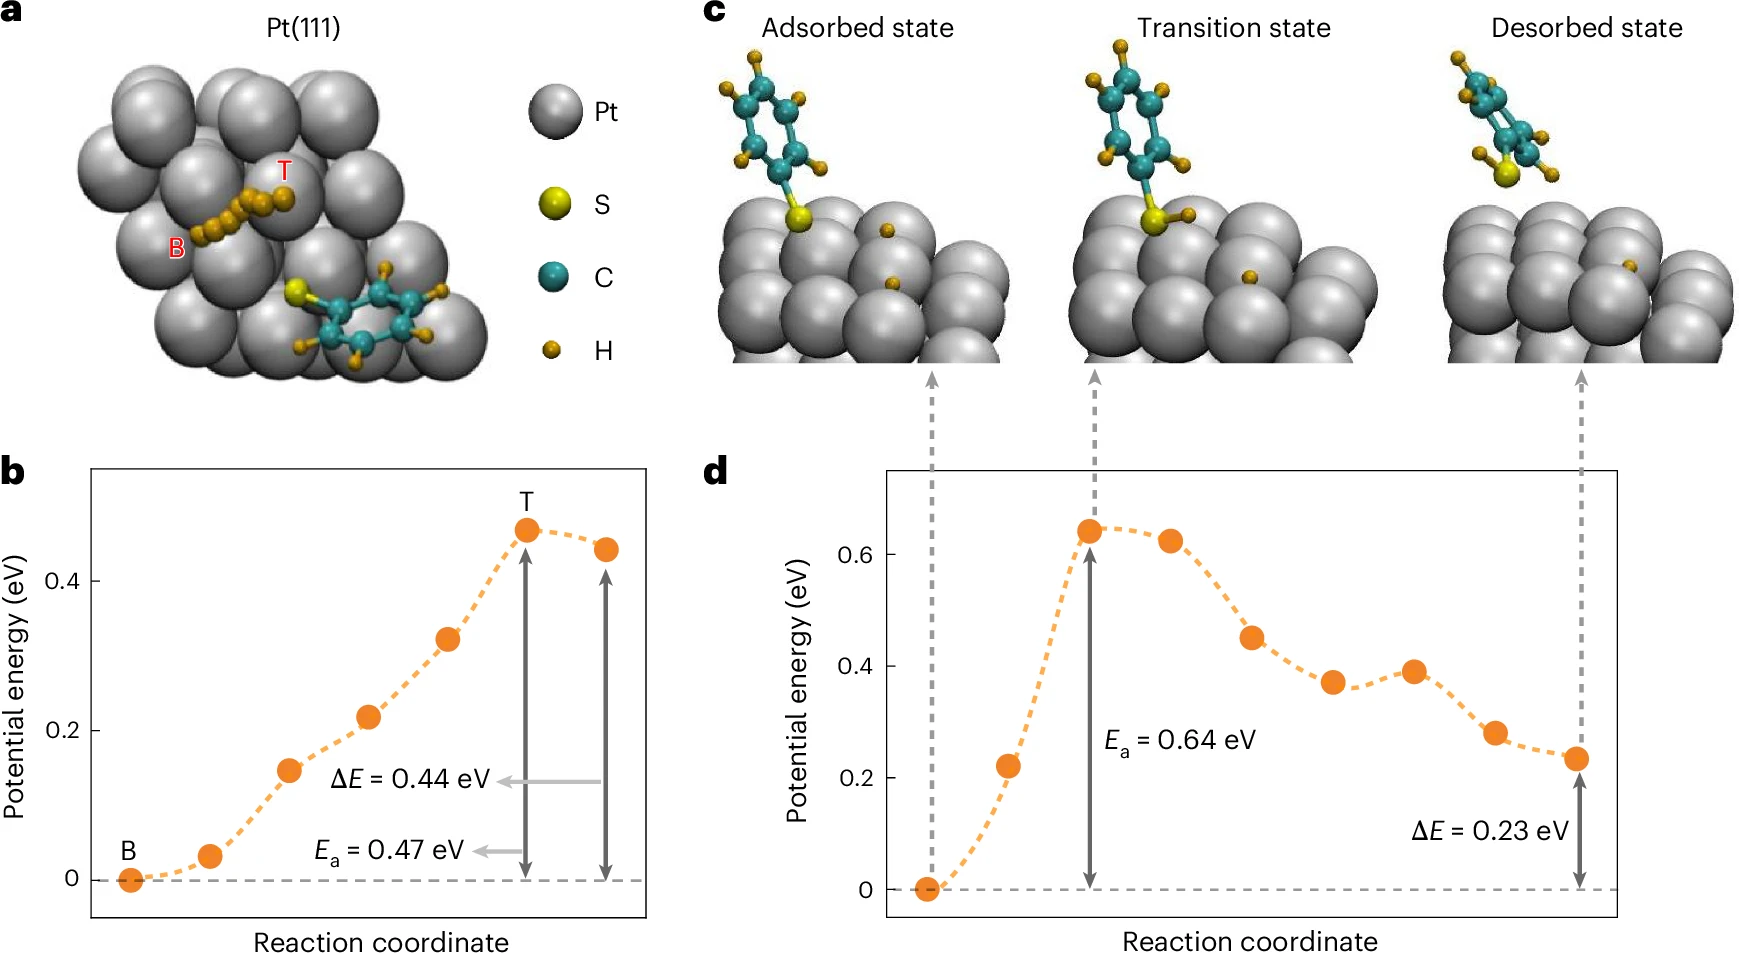
Fig. 4: Density functional theory calculations of the energy barriers for H hopping and thiol desorption on the Pt(111) surface.
Because the reporter-loss footprint was much wider than the calculated optical near field, the team also examined surface transport. Density functional theory (DFT) calculations found bridge-site H adsorption to be 0.44 eV more stable than top-site adsorption. A 0.47 eV bridge-to-top hopping barrier produced a modelled rate of 1.4 × 10⁴ s⁻¹ when an attempt frequency of 10¹² s⁻¹ was assumed.
For the desorption calculations, the more computationally tractable benzenethiol (PhSH) was used in place of OPE. The calculated barriers were 0.64 eV for desorption assisted by top-site H and 1.04 eV for desorption assisted by bridge-site H. With an assumed prefactor of 10¹³ s⁻¹, the corresponding rates were approximately 180 s⁻¹ and 3 × 10⁻⁵ s⁻¹. These values correspond to characteristic timescales of approximately 6 ms and 8 hours, respectively.
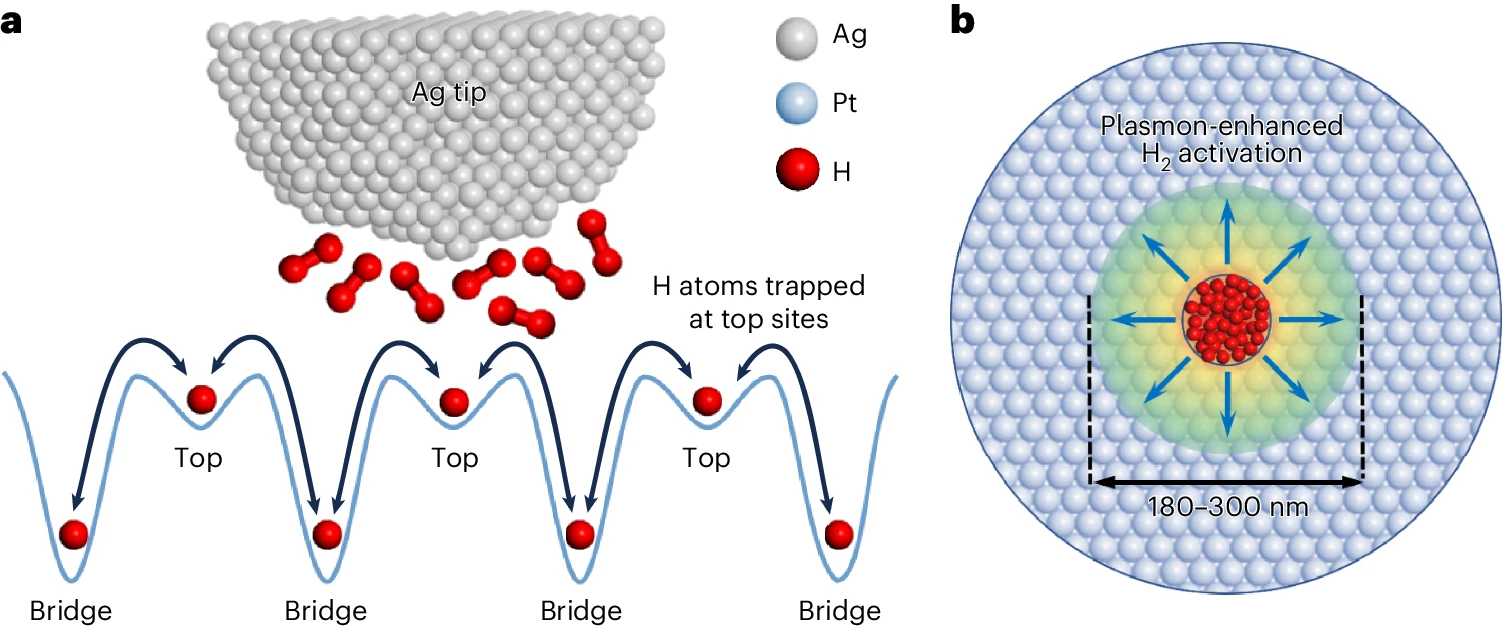
Fig. 5: H propagation beyond the tip-enhanced Raman spectroscopy near field on the Pt(111) surface.
The authors combined these calculations with the spatial maps to propose that high local H coverage increases competition for favourable adsorption sites and creates a transient chemical-potential gradient, driving excess hydrogen outward. They describe this collective mechanism as a crowd effect. It provides a coherent explanation for how chemistry initiated within a narrow optical near field could leave a much broader reporter-loss footprint.
The crowd effect remains a model-supported interpretation of indirect spatial evidence. It is not a directly recorded trajectory of hydrogen diffusion and has not been established as the only possible transport mechanism.
Takeaways and outlook
By combining time-resolved spectra, nanoscale maps, light-off and Au(111) controls, heat-transfer modelling, hot-electron calculations and DFT kinetics, the study develops a detailed mechanistic picture around a single illuminated junction.
The strongest experimental result is the localized excess loss of the OPE reporter observed in two independent mapping experiments under the stated Pt(111), illumination and H₂-exposure conditions. The combined evidence then supports hot-electron-assisted H₂ activation and the outward propagation of surface hydrogen as the authors’ mechanistic interpretation.
The study focuses on one single-crystal surface orientation, one type of reporter layer and a restricted set of tip-cavity conditions. It does not measure hydrogenation products, selectivity, energy efficiency or reactor-scale performance. Quantitative interpretation is also limited by the idealized tip geometries used in the finite-element model, the nanoparticle-dimer approximation used in the hot-electron calculation, the substitution of PhSH for OPE in the DFT analysis and the assumed attempt frequencies used to estimate kinetic rates.
Direct measurements of surface H, systematic variation of reporter coverage and junction geometry, replicated spatial statistics and connections between nanoscale reporter maps and catalytic turnover would help establish how broadly the proposed mechanism applies.
About the researchers
Zhen-Feng Cai (Sichuan University and ETH Zurich) is the first author of this study. Meghna A. Manae, Jeremy O. Richardson and Naresh Kumar are affiliated with ETH Zurich. Zi-Xi Tang, Jun-Xian Zhang and Yao Zhang are affiliated with the University of Science and Technology of China.
Zhen-Feng Cai, Yao Zhang, Jeremy O. Richardson and Naresh Kumar are the corresponding authors.
Original research
Zhen-Feng Cai, Meghna A. Manae, Zi-Xi Tang, Jun-Xian Zhang, Yao Zhang, Jeremy O. Richardson and Naresh Kumar. “Nanoscale visualization of plasmon-enhanced hydrogen activation on a Pt(111) surface.” Nature Chemistry (2026). DOI: 10.1038/s41557-026-02245-z. Published online 10 September 2026. Open access under CC BY-NC-ND 4.0. Images reproduced without modification.
Research POP Notes
This article reflects the independent interpretation of the Research POP team. If you identify any inaccuracies or have concerns regarding the content, figures or attribution, please contact us at team.researchpop@gmail.com. We will review the matter promptly and make corrections or remove the relevant material where appropriate.